|
How to use the Waveform Analyzer |
  
|
|
How to use the Waveform Analyzer |
  
|
After loading a sound the embedded Waveform Analyzer, implemented through the WaveformAnalyzer class, allows performing a detailed analysis of the sound itself with the purpose of generating a graphical representation of the sound's waveform.
The first step is to perform the sound's analysis through a call to the WaveformAnalyzer.AnalyzeFullSound method: the analysis can be more or less accurate depending upon the resolution set into the nResolution field of the WANALYZER_GENERAL_SETTINGS data structure: higher resolutions will allow a better quality because more peaks will be detected: as a side effect, higher resolutions will require more memory and will generate larger bitmaps. When the results of an analysis are no more needed, the involved memory can be released through a call to the WaveformAnalyzer.FreeMemory method. The analysis can be aborted at any time through a call to the WaveformAnalyzer.AnalyzeAbort method.
After calling this method, the control will allow the container application to stay up-to-date about the analysis advancement through the following events:
| • | WaveAnalysisStart: fired when the sound's analysis begins. |
| • | WaveAnalysisPerc: fired several times during the analysis in order to inform the container application about the percentage of advancement. |
| • | WaveAnalysisDone: fired when the sound's analysis is completed |
After completing the waveform analysis, you can request the level, expressed in percentage, of the highest and of the lowest peaks available inside a certain range of the waveform through the WaveformAnalyzer.GetMinMaxPeakLevelsForRange method.
At this point it's possible creating a graphical representation of analyzed sounds in one of the following modes:
Mode 2: Creation of bitmaps in various graphic formats
Mode 3: Rendering on a graphic Device Context (HDC)
In order to start the visual editing of the sound's waveform, we need to create the Waveform Analyzer user interface through a call to the WaveformAnalyzer.Create method. By default the Waveform Analyzer user interface will appear as in the picture below where the top waveform represents the left channel of a stereo sound while the bottom waveform represents the right channel of a stereo sound (sounds in mono are rendered using one single waveform):
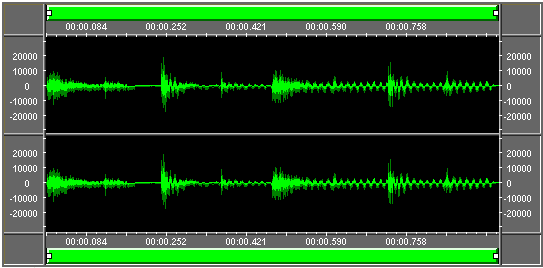
Once the waveform analysis has been performed, you can immediately display the full waveform on the visible area of the analyzer through a call to the WaveformAnalyzer.SetDisplayRange method by passing 0 and -1 respectively to the nBeginPosInMs and nEndPosInMs parameters.
In alternative to the classical waveform's representation of maximum and minimum peaks values visible on the screenshot below
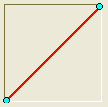
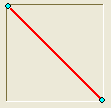
the waveform analyzer, through the WaveformAnalyzer.ViewModeSet method, can be set to display the waveform through its absolute values as seen on the screenshot below
or through the spectral view of the loaded sound as seen on the screenshot below
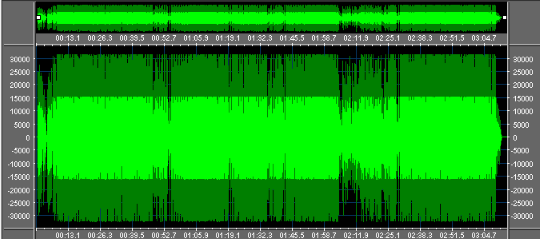
In this specific case, each time a spectral analysis is requested, the control will allow the container application to stay up-to-date about the spectral analysis advancement through the following events:
| • | WaveAnalyzerSpectralViewStart: fired when the spectral analysis begins. |
| • | WaveAnalyzerSpectralViewPerc: fired several times during the analysis in order to inform the container application about the percentage of advancement. |
| • | WaveAnalyzerSpectralViewDone: fired when the spectral analysis is completed |
As most Windows controls with an user interface, the Waveform Analyzer can be:
| • | shown or hidden through the WaveformAnalyzer.Show method |
| • | moved or resized through the WaveformAnalyzer.Move method |
| • | refreshed through the WaveformAnalyzer.Refresh method |
| • | destroyed through the WaveformAnalyzer.Destroy method |
| • | scrolled through the WaveformAnalyzer.Scroll method: scrolling can be also performed panning the horizontal scrollbars with the mouse. |
| • | it's also possible replacing the standard cursors, used for scrolling and resizing, operations through the WaveformAnalyzer.SetTrackerCursors method |
The graphical rendering of this control is fully customizable and you can modify colors used to render the various elements and hide/show all of the elements surrounding the waveform representation; for this purpose you can gain access to the various settings through the following set of data structures using the provided methods:
| • | general settings are managed through the WANALYZER_GENERAL_SETTINGS data structure accessible through the combination of the WaveformAnalyzer.SettingsGeneralGet and WaveformAnalyzer.SettingsGeneralSet methods. |
| • | rulers rendering settings are managed through the WANALYZER_RULERS_SETTINGS data structure accessible through the combination of the WaveformAnalyzer.SettingsRulersGet and WaveformAnalyzer.SettingsRulersSet methods. |
| • | scrollbars rendering settings are managed through the WANALYZER_SCROLLBARS_SETTINGS data structure accessible through the combination of the WaveformAnalyzer.SettingsScrollbarsGet and WaveformAnalyzer.SettingsScrollbarsSet methods. |
| • | waveform rendering settings are managed through the WANALYZER_WAVEFORM_SETTINGS data structure accessible through the combination of the WaveformAnalyzer.SettingsWaveGet and WaveformAnalyzer.SettingsWaveSet methods. |
The Waveform Analyzer allows selecting/deselecting portions of the displayed waveform in two different ways:
| • | through code using the WaveformAnalyzer.SetSelection method. |
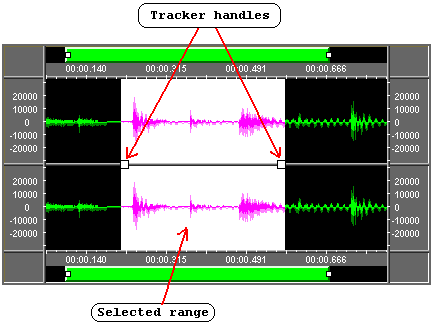
| • | through mouse acting directly on the waveform area: simply press the left button, drag the mouse position keeping the left button pressed and then release the left button: the selected area will appear with its colors inverted and with two tracker handles that will allow further manual resizing of the selected range; this selection can be also moved performing a mouse panning. After these manual operations the control can obtain the selected area through the WaveformAnalyzer.GetSelection method. |
The Waveform Analyzer allows zooming the displayed waveform in two different ways:
| • | through code using one of the following methods: WaveformAnalyzer.SetDisplayRange, WaveformAnalyzer.ZoomIn, WaveformAnalzyer.ZoomOut, WaveformAnalyzer.ZoomToFullSound, WaveformAnalyzer.ZoomToSelection. After zooming in and out, you can obtain the current sound's range displayed on the Waveform Analyzer calling the WaveformAnalyzer.GetDisplayRange method and to obtain the length of this range in milliseconds and pixels using the WaveformAnalyzer.GetDisplayWidth method. |
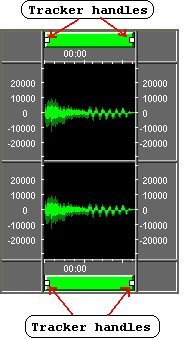
| • | through mouse acting directly on the tracker handles of one of the available horizontal scrollbars as seen on the picture below: |
Whenever a change occurs on the user interface, the container application is notified through one of the following events:
| • | WaveAnalyzerSelectionChange: this event occurs when a selection/deselection is performed |
| • | WaveAnalyzerDisplayRangeChange: this event occurs when a new range within the sound is displayed |
| • | WaveAnalyzerDisplayWidthChange: this event occurs when the control is resized horizontally |
When the waveform analyzer, through the WaveformAnalyzer.ViewModeSet method, has been set to display the spectral view instead of the classical waveform and a zoom or panning operation is performed (through the scrollbars or by code), the spectral view is calculated again inside a secondary thread so scrollbars are enabled but the new spectral analysis is performed when the mouse button, acting on the "tracker handles", is released and not while the mouse is being moved.
In order to allow management of mouse interaction, you can catch the WaveAnalyzerMouseNotification event which reports the exact position where the mouse was pressed on the waveform: accurate positioning is guaranteed also when the waveform is zoomed. Mouse interaction can be enabled/disabled through the WaveformAnalyzer.MouseSelectionEnable method. During a playback session the mouse interaction is automatically disabled and an eventual call to this method will be ignored.
Each graphical element composing the Waveform Analyzer visualization (scrollbars, time rulers, etc.) is referenced by a specific rectangle on the screen: coordinates and dimensions of this rectangle, expressed in pixels, can be obtained through the WaveformAnalyzer.GetRectangle method.
Each time the graphical rendering of the Waveform Analyzer is completed, the container application receives a WaveAnalyzerPaintDone event: this event will pass as parameter the HWND of the Waveform Analyzer window, allowing to perform further custom graphic rendering on the Waveform Analyzer surface; for this purpose you can obtain the handle to the device context (HDC) of the Waveform Analyzer through the GetDC Windows API.
The Waveform Analyzer automatically manages two vertical lines, one for displaying the current position during a playback session and another one for displaying a position, selected through the mouse, within the loaded sound: the look of these two lines can be modified through the WANALYZER_GENERAL_SETTINGS data structure mentioned before.
The waveform analyzer allows adding further graphical items like vertical lines, horizontal lines and wave ranges: for details about graphic items management you can refer to the How to add graphic items to the Waveform analyzer tutorial.
Mode 2: Creation of bitmaps in various graphic formats
After catching the WaveAnalysisDone event, it will be possible requesting to the control the creation of the waveform's bitmap through a call to the WaveformAnalyzer.SnapshotViewSaveToFile and WaveformAnalyzer.SnapshotViewSaveToMemory methods. It's important to note that the WaveAnalysisDone event will report the exact number of peaks detected inside the loaded sound and the exact duration in milliseconds of each peak. When generating the bitmap for the full sound's waveform, the reported number of peaks will be exactly equal to the width in pixels of the bitmap. In case you should create a view of a given sound's range, you could obtain the number of pixels needed to display the waveform's view through a call to the WaveformAnalyzer.SnapshotViewGetWidthForWaveform method.
The generated waveform's bitmap will be rendered using colors set into the colorWaveLinePeak, colorWaveLineCenter and colorWaveBackground fields of the WANALYZER_WAVEFORM_SETTINGS data structure.
Below you can see five bitmaps generated using the same sound (whose duration is around 2.4 seconds length) but with five different resolutions (just for your information the song used for generating these bitmaps is available on this link); all these bitmaps have been created using the same height of 100 pixels:
Resolution set into the nResolution property |
Generated bitmap |
|
|
WAVEANALYZER_RES_MAXIMUM |
|
WAVEANALYZER_RES_VERY_HIGH |
|
WAVEANALYZER_RES_HIGH |
|
WAVEANALYZER_RES_MIDDLE |
|
WAVEANALYZER_RES_LOW |
|
As mentioned before, you can also generate a "view" of a defined portion of the loaded sound: on the bitmap below you can see the original song in its full length (with WAVEFORM_RES_MAXIMUM resolution)

and below you can see the view of the same song for the range between 500 and 1500 milliseconds

On the samples above we have used a very small song limited to 2.4 seconds: in case you should be in need of displaying the full waveform of a longer song on a space much smaller than the total number of required pixels, the WaveformAnalyzer.SnapshotViewSaveToFile and WaveformAnalyzer.SnapshotViewSaveToMemory methods will shrink the waveform in order to fit exactly inside the available space; in the example below you can see a 3 minutes song fitting inside a 455 pixels wide bitmap: the original full length bitmap, using the WAVEFORM_RES_MAXIMUM resolution, would require a width of 243,683 pixels.

VERY IMPORTANT: When using high resolutions and big sound files, keep count that the Windows operating system has limits on the size of bitmaps creation; this means that it would be better avoiding the creation of very large bitmaps: in this case it would be a better approach splitting the total song's bitmap into several smaller bitmaps, for example creating bitmaps whose width in pixels doesn't exceed the current screen width.
Mode 3: Rendering on a graphic Device Context (HDC)
After catching the WaveAnalysisDone event, it will be also possible rendering the waveform directly inside a graphical device context (through its handle or HDC) using the WaveformAnalyzer.SnapshotViewDrawToHdc method; this may be quite useful if you should need to perform real-time rendering of the waveform on the screen. Although this could be also used for creating a scrolling waveform during playback, we suggest checking the How to scroll the sound's waveform during playback tutorial for further details about managing a scrolling waveform.
When rendering the waveform on a device context, you have the option to choose if the rendered waveform must contain eventual custom graphic items also (for details about graphic items management you can refer to the How to add graphic items to the Waveform analyzer tutorial) by setting the bShowGraphicItems parameter of the WaveformAnalyzer.SnapshotViewDrawToHdc method to "true" or "false": if this parameter should be set to "true", you may choose which combination of items should be rendered by setting the rendering mask through the WaveformAnalyzer.SnapshotViewGraphicItemsMaskSet method.
In case you should need to perform your own graphic rendering of waveform's peaks, after the analysis you could obtain peak values for the full file or for a portion of the same through the WaveformAnalyzer.PeaksBufferGet method.