|
How to perform custom feedbacks rendering using graphic bars |
  
|
|
How to perform custom feedbacks rendering using graphic bars |
  
|
Audio Sound Recorder API for .NET comes with some new graphical feature implemented through the GraphicBarsManager property: one of these features is the capability to display graphic bars in both horizontal and vertical orientations; these bars work as child controls of the container form (with their own HWND window handle) so the first thing to do is to create one or more instance of the control through a call to the GraphicBarsManager.Create method; as all of the other windows control, the graphic bars can be moved and resized (GraphicBarsManager.Move method), shown or hidden (GraphicBarsManager.Show method), refreshed (GraphicBarsManager.Refresh method) or destroyed (GraphicBarsManager.Destroy method).
Graphic bars can be used for the following purposes:
| • | VU-Meter bars rendering |
| • | Spectrum bars rendering |
| • | Progress bars rendering |
Exactly as for regular Progress bar control, graphic bars have a range, defined through the GraphicBarsManager.GetRange and GraphicBarsManager.SetRange methods, and a value defined through the GraphicBarsManager.GetValue and GraphicBarsManager.SetValue methods.
Graphical settings related to a specific graphic bar can be retrieved and modified through the GraphicBarsManager.GetGraphicalSettings and GraphicBarsManager.SetGraphicalSettings methods: both of them receive in input a GRAPHIC_BAR_SETTINGS data structure which can manage the following settings:
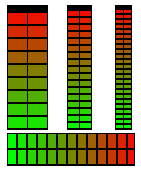
| • | Orientation through the nOrientation member. This is quite important because .NET doesn't come with a native vertical progress bar. On the picture below you can see some sample of both vertical and horizontal graphic bars. |

| • | Colors through the colorStart, colorEnd and colorBackground members: you can define two colors used for rendering the current value so the graphic bar can display either a gradient color or a solid color. |
| • | 3D appearance through the bAppearance3d member. |
| • | Smoothing through the bSmoothing member; graphic bars can be led-based but they can also appear smoothed as seen on the images below: |
![]()
![]()
| • | Automatic drop through the bAutomaticDrop member; this feature allows decreasing the displayed value to 0 with a certain delay as seen on certain hardware based VU-meters when no input sound is available. |
| • | Gradient shape through the nShape member; you can define how the gradient limits are rendered as seen on the samples below: |
![]()
![]()
![]()
When using the graphic bar for rendering a VU-Meter bar, you will have to set the range of the graphic bar from 0 to 32767 (using the GraphicBarsManager.SetRange method) and use values sent through the CallbackVuMeterValueChange delegate when calling the GraphicBarsManager.SetValue method.
When using the graphic bar for rendering a Spectrum bar, you will have to set the range of the graphic bar from 0 to 100 (using the GraphicBarsManager.SetRange method) and, after the CallbackVuMeterValueChange delegate has been invoked, make a call to the Spectrum.GetTable method in order to obtain the 64 values of the spectrum's table: at this point, depending upon the number of instanced spectrum bars, call the GraphicBarsManager.SetValue method for each of them passing the related value contained inside the spectrum table.
Samples of use of the GraphicBarsMan class in Visual C#.NET and Visual Basic.NET can be found inside the following samples installed with the product's setup package:
- Feedbacks
- RecordedSoundEditor
- SimpleMp3Recorder